Poland has the European Union’s most polluted air, according to a new report from the European Environment Agency (EEA). The country also recorded among the lowest reductions in air pollution during the pandemic lockdown.
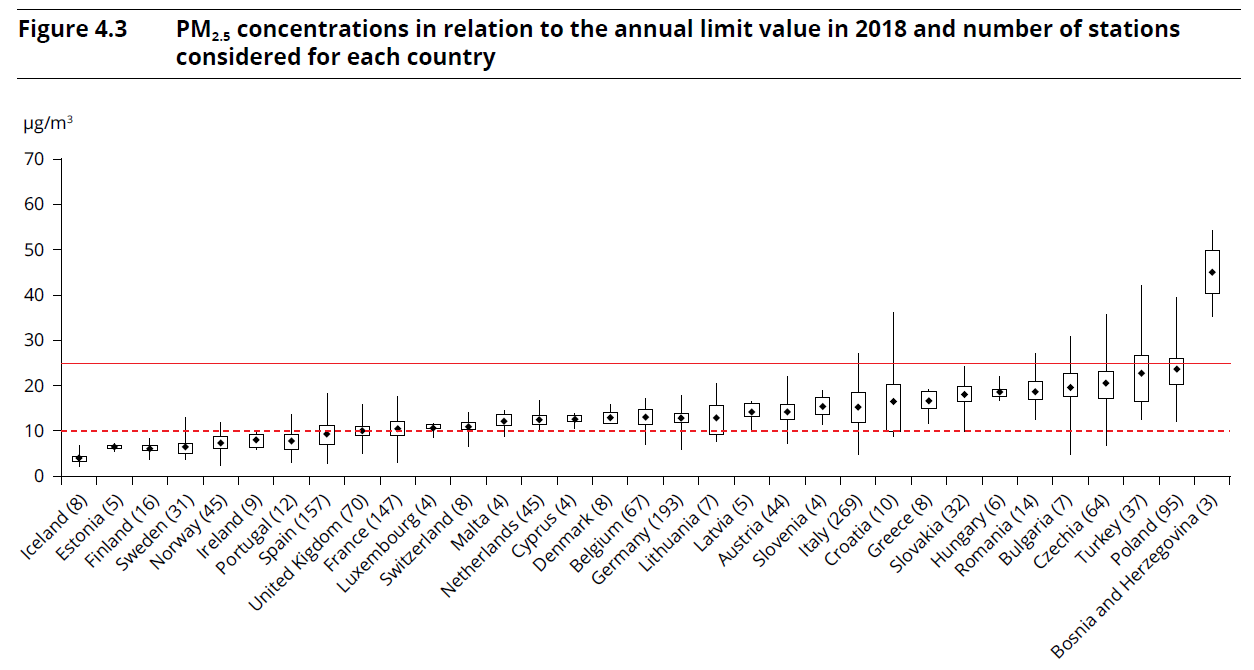
The Air Quality in Europe 2020 report found that the concentration of both PM10 and PM2.5 – two types of harmful airborne participate matter – was higher in Poland than in any other EU country.
Poland has long had some of Europe’s lowest air quality, in part due to the burning of low-quality fuels to heat homes, as well as the country’s reliance on coal. Recent years have seen grassroots initiatives as well as government programmes aiming to reduce pollution levels – with mixed results.
The report – based on data from 2018 – shows that pollution in almost all areas of Poland exceeds European air standards. Concentrations of PM10 in the southwestern coal heartlands exceeded the EU daily limit value by over 50%.
The EEA also found that air pollutants caused nearly 50,000 premature deaths in Poland in 2018. Most of those – 46,300 – were caused by PM2.5. In the EU overall, PM2.5 caused the premature deaths of 379,000 people, meaning that one in eight were Polish.
Only Germany (63,100) and Italy (52,300), both of which have much larger populations than Poland, recorded highest numbers of premature deaths attributed to PM2.5.
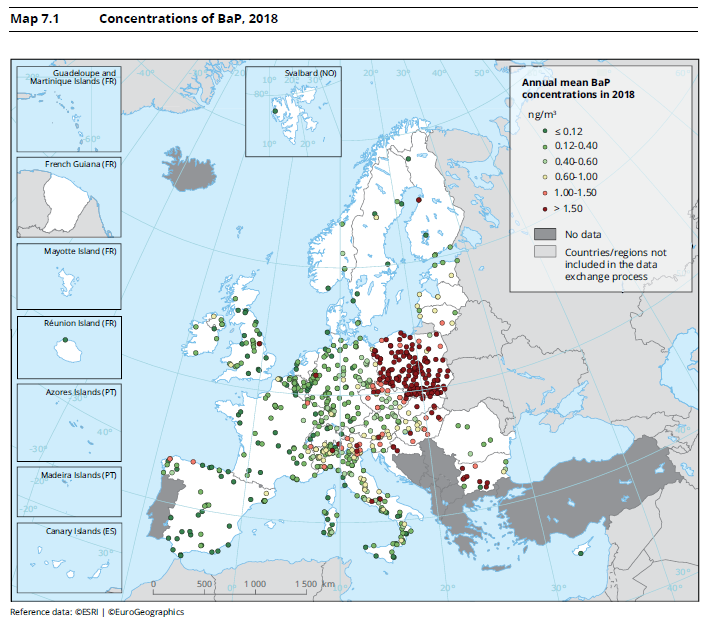
According to the report, Poland is also the worst country in the EU for levels of benzo[a]pyrene (BaP) pollution, which often originates from the domestic combustion of coal and wood.
The EEA also analysed the effects of lockdown measures to curb the spread of coronavirus. Although some countries reported a temporary reduction in emission levels, Poland was found to have had one of the lowest reduction rates in April 2020, with some areas even reporting higher levels of NO2 pollution.
Earlier this year, the Air Quality Life Index also found Poland to have the worst air in Europe. In 2018, the World Health Organisation found that 36 of the EU’s most polluted cities were in Poland.
To tackle this longstanding problem, the government in 2018 launched a “Clean Air” programme – theoretically one of the largest of its kind in Europe – which aimed to reduce smog by providing households with funds to replace old heaters and to improve insulation.
However, the initiative has not had the hoped-for impact. Poor implementation and resultant low take-up of the subsidies led the European Commission to consider withdrawing funding for the programme.
Poles living in rural communities had particular difficulties in accessing funds. In September, the climate ministry moved to close a loophole that had previously left many of the poorest households excluded from subsidies.
The same month, the ministry unveiled an updated energy strategy for the next two decades, which outlines a faster withdrawal from coal than previously planned. Soon after, a landmark agreement concluded between the government and mining unions pledged to close all coal mines by 2049.
A government scheme to subsidise the installation of solar panels in private homes has also been a success, with funds designated for the programme already running low.
Meanwhile, many cities have taken the initiative to battle smog. Kraków, which has been notorious for its bad air in recent years, in 2019 became the first place in Poland to ban the burning of coal and wood. It also launched a mobile app allowing residents to report people they suspected of burning illegal material.
Over the coming months, Polish Smog Alert, a grassroots social movement, will be running a “See What You Breathe” campaign, during which giant “breathing” lung installations will tour 18 Polish towns and cities to show residents how much pollution they are inhaling on a daily basis.
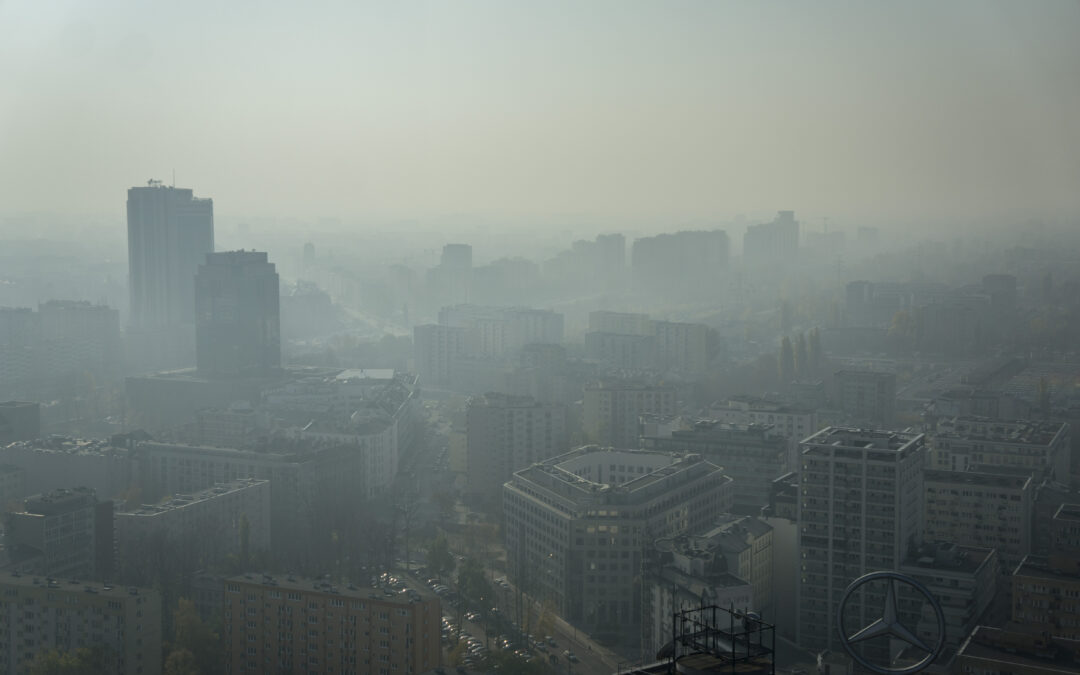
Main image credit: Radek Kołakowski/Flickr (under CC BY 2.0). Charts © European Environment Agency, 2020.

Juliette Bretan is a freelance journalist covering Polish and Eastern European current affairs and culture. Her work has featured on the BBC World Service, and in CityMetric, The Independent, Ozy, New Eastern Europe and Culture.pl.