
By Pawel Bukowski
Myth 1: Income inequalities in Poland have been low and stable
Reality: They are one of the highest in the EU and have been rising.
According to the official measures of inequality published by Eurostat and Statistics Poland (GUS), Poland’s level of income inequality declined between 2011 and 2018. The level was below the EU average and among the lowest coefficients in the EU.
Yet the official estimates underestimate the true level of inequality because they are based on household survey data. Those do not capture the richest individuals because they rely on a random sample of households and very rich individuals, who matter a lot for measures of inequality, have a very low chance of being surveyed.
The estimates for Poland in the work of myself, Filip Novokmet, Paweł Chrostek and Marek Skawiński avoid this problem by combining the survey data with tax data, which cover all taxpayers and thus capture the income of the richest.
Figure 1: The top 1% income share in Poland and other countries, 1983-2018
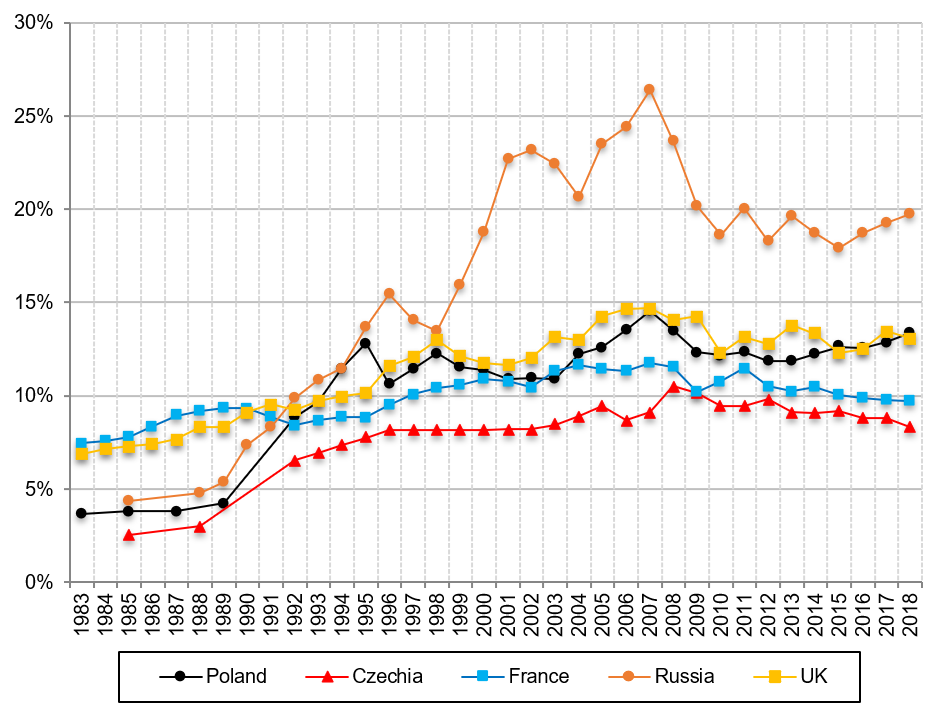
Source: Bukowski, P., & Novokmet, F. (2021). Between communism and capitalism: long-term inequality in Poland, 1892–2015. Journal of Economic Growth, 26(2), 187-239; Bukowski, P., Chrostek, P., Novokmet, F., & Skawiński, M. (2023). Income inequality in the 21st century Poland. CEP Discussion Paper No. 1966; World Income Database
The improved estimates show that inequalities in Poland are one of the highest in the EU and have been rising.
I focus here on income shares, a popular measure of inequality, which show what portion of the total income is earned by, for instance, the top 10 percent richest among the population, the bottom 50 percent, or the middle 40 percent.
In 2018, the share of pre-tax income accrued by the top 10 percent was 37.4%; for the middle 40 percent it was 41.1%; and for the bottom 50 percent only 21.5%. The top 1 percent earned 13.4% of the total income.
Figure 2: The top 1% income share in Poland and the EU, 2018
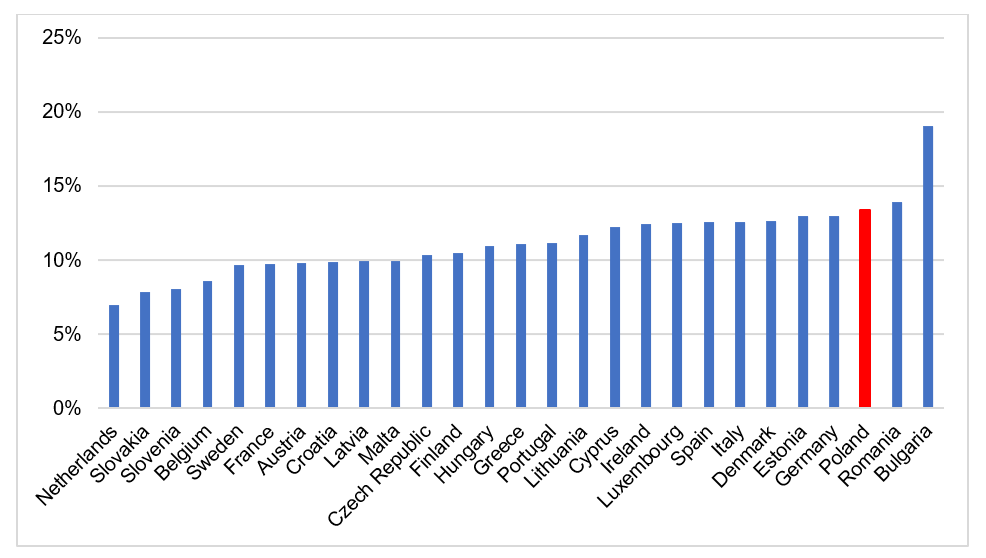
Source: Bukowski, P., Chrostek, P., Novokmet, F., & Skawiński, M. (2023). Income inequality in the 21st century Poland. CEP Discussion Paper No. 1966; World Income Database
When compared with data from the World Income Database, which uses the same methodology, Poland’s level of inequality is similar to that of UK – where the top 10 percent earn 36% of total income – but is considerably higher than in France (32%) or the Czech Republic (29%).
Poland’s level of inequality, as defined in these studies, is nonetheless below the levels seen in Russia or the United States, where the top 10 percent capture more than 45% of total income.

By contrast, in 1989 Poland was among Europe’s most egalitarian countries, with the top 10 percent earning around 22% of total income. As highlighted by Bukowski and Novokmet (2021), the ensuing three decades saw significant increases in inequality, particularly during two key periods: immediately after the transition from communism to capitalism and post-2004, coinciding with Poland’s entry into the EU.
The initial surge in inequality was an expected outcome of the shift to a market economy and related free-market reforms. The increase in inequality after 2004 is attributed to the growing importance of capital income.
Myth 2: The impressive economic growth after 2000 “has lifted all boats equally”
Reality: Real income grew for everyone, but the rich captured a disproportionally bigger part of the growth.
Table 1: Average annual growth rate and the distribution of growth in Poland
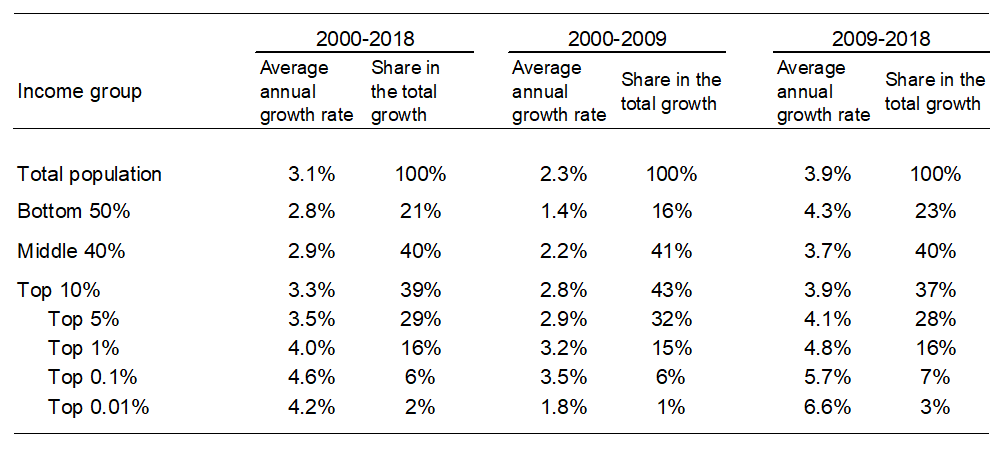
Source: Bukowski, P., Chrostek, P., Novokmet, F., & Skawiński, M. (2023). Income inequality in the 21st century Poland. CEP Discussion Paper No. 1966
Over the 2000=2018 period, average real income per adult has increased by about 3.1% per year. However, as the table above shows, this average growth has not been experienced by all groups.
Both the bottom 50 percent and middle 40 percent experienced below-average growth over this period, respectively 2.8% and 2.9% per year, while the top 10 percent increased 3.3% per year.
However, the growth of the top decile was heavily tilted towards the groups within the top 5 percent, which are the only groups that experienced above-average growth rates. Specifically, the growth was particularly large for the top 1 percent (4% per year) and the top 0.1 percent (4.6%).
Next, if we divide that period in half, it can be seen that average income growth was higher in the second half, 2009-18, at about 3.9% per year in comparison to 2.3% per year in the 2000-9 period.
However, the distribution of growth was more skewed in the 2000s, with growth rates increasing as one moves up the distribution: 1.4% per year for the bottom 50 percent, 2.2% per year for the middle 40 percent, and 2.8% for the top 10 percent.
By contrast, the growth was more equal in the 2010s: in fact, it was the highest for the bottom 50 percent, which grew at an above-average 4.3% per year in comparison to 3.7% per year for the middle 40 percent and 3.9% per year for the top 10 percent.
Myth 3: Poland has high progressive taxes and a generous redistribution system
Reality: Redistribution helps the poor but also the rich. The very rich face lower effective taxation than the middle class
Figure 3: The effect of redistribution of income shares in Poland, 2018
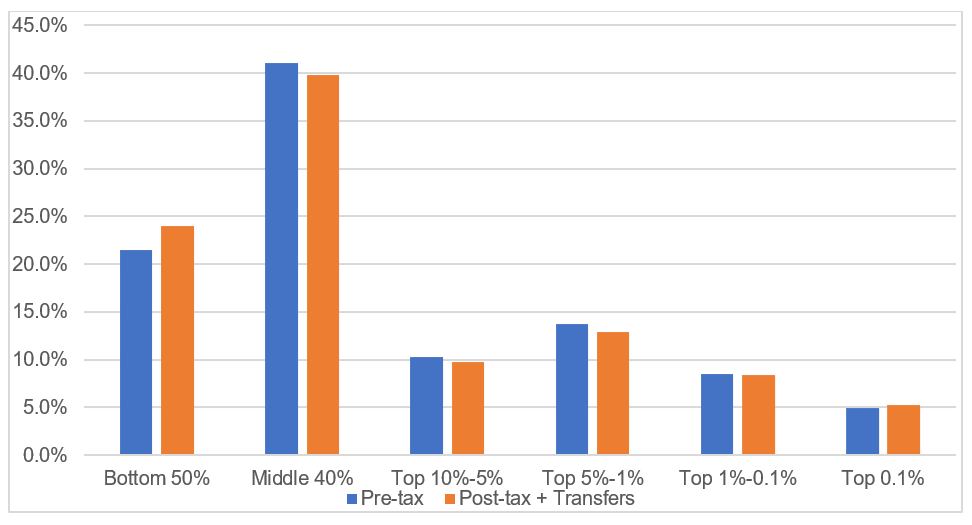
Source: Bukowski, P., Chrostek, P., Novokmet, F., & Skawiński, M. (2023). Income inequality in the 21st century Poland. CEP Discussion Paper No. 1966
The income redistribution system in Poland has had a limited effect on the country’s income inequalities. Rather than mitigating disparities, the system tends to benefit both the poorest and the richest, often at the expense of middle-income groups.
For example, in 2018, after accounting for taxes, social security, health contributions, and social benefits, the top 1 percent of earners had a post-tax income share of 13.6% (0.2 pp higher than pre-tax). Meanwhile, the bottom 50 percent saw their share rise to 23.9% (2.4 pp higher) and the middle 40 percent experienced a decrease to 39.8% (1.3 pp lower).
The Polish personal income tax system in 2018 was regressive for the top incomes because individuals with high business income could choose to be taxed using a linear tax rate of 19%, rather than through progressive rate of 32%. Those with labour income, who are more likely to be found in the group between the 90th and the 99th percentiles (rich, but not the richest), did not have this option.
In addition, social-security contributions were also regressive: wage earners paid contribution as a percentage of earning, but capped at certain level, and business owners paid a flat (income-invariant) contribution.
Myth 4: The rich in Poland are high-wage workers: managers, IT specialists, those working for foreign companies
Reality: The rich are home-grown entrepreneurs
Figure 4: Income sources across the income distribution, Poland 2018
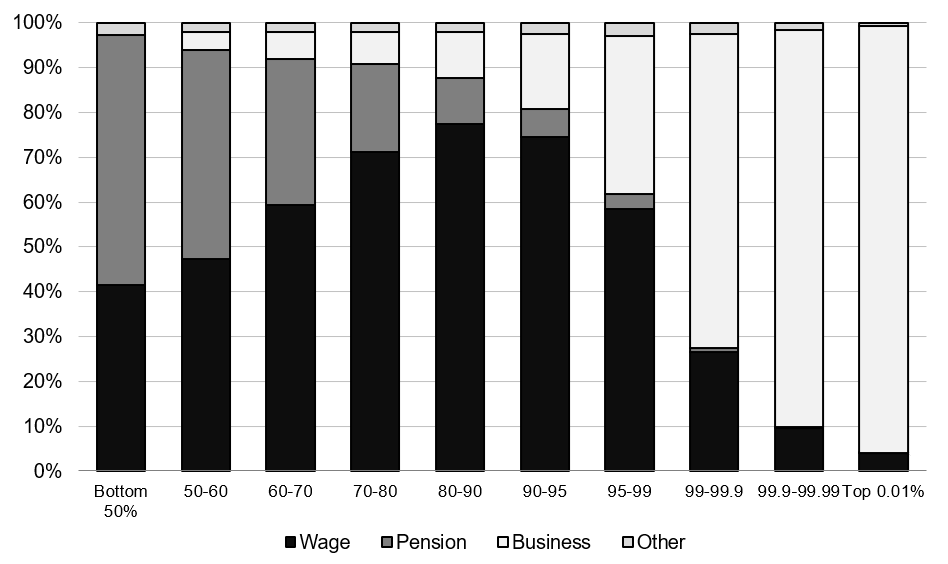
Source: Bukowski, P., Chrostek, P., Novokmet, F., & Skawiński, M. (2023). Income inequality in the 21st century Poland. CEP Discussion Paper No. 1966
The rich in Poland today are mostly business owners and this group is one of the main beneficiaries of the robust economic growth since 2000. As presented in the figure above, the income of the poorest 50 percent is mostly pensions (58%) and wages (40%).
The higher we look in the distribution of income, the bigger the role of wages and the smaller of pensions. In the ninth decile (between the 80th and the 90th percentiles), the former constitutes 79% of the total income and the latter only 11%.
In the top decile, however, business income is the most important source. Between the 90th and 95th percentiles, it constitutes 16% of the total income and between the 95th and 99th percentiles its share more than doubles to 34%. In the top 0.01%, 95% of income is from business sources and only 4% from employment. Moreover, the importance of business income has been growing since 2000.
Myth 5: There is a growing gap between urban and rural areas
Reality: Big cities are richer, but rural and semi-urban areas have been catching up. Small cities are losing.
The national top 1 percent of earners are predominantly found in large cities, such as Warsaw, Wrocław and Poznań, but there is a growing presence of high-income individuals in rural and semi-urban areas.
In 2018, 60% of Poles from the national top 1 percent lived in urban areas, with 35% of them residing in cities with over 250,000 inhabitants. There are 11 cities with a population exceeding 250,000, housing just over 6.5 million people. This constitutes around 18% of our country’s population. Thus, in the largest cities, the wealthy are overrepresented.
This overrepresentation of the rich in big cities, however, is steadily declining. Meanwhile, the rise in the percentage of the rich in rural municipalities is quite dynamic, going from 14% in 2004 to 21% in 2018. These changes are not due to shifts in the population of municipalities.
Figure 5: The relative contribution to the national top 1% income group, Poland 2004-2018
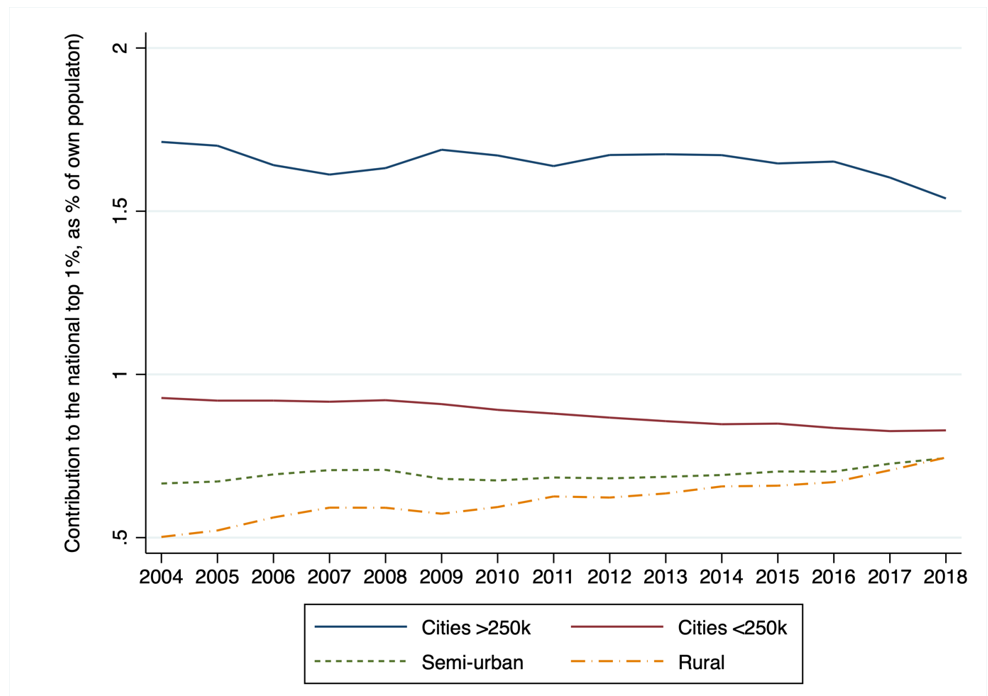
Source: Bukowski, P., Chrostek, P., Novokmet, F., & Skawiński, M. (2023). Income inequality in the 21st century Poland. CEP Discussion Paper No. 1966
Similar trends are observed when looking at the figure above, which shows what percentage of residents in a given group belong to the top one percent nationally.
If the income distribution in Poland were perfectly even, each group would be 1%. Of course, this is not the case. Only large cities significantly exceed 1% – in 2018, it is still over 1.5%. However, this percentage is continuously decreasing – in 2004, it was 1.7%.
The smaller cities are also declining. However, there is a rise in urban-rural and rural municipalities. Especially notable is the increase in rural areas – from 0.5% in 2004 to 0.75% in 2018. This is a very interesting trend, indicating an increasing attractiveness of areas outside the cities.
It is worth noting that this isn’t just about localities surrounding large cities (such as Podkowa Leśna or Milanówek west of Warsaw), but also includes rural municipalities with industrial clusters.
Myth 6: The economic gender gap in Poland is small
Reality: The raw income gap is around 33% and has been stubbornly stable since 2000.
Since 2000, high-income groups have consistently been male-dominated, with a higher male percentage in the narrower top income groups. Within the top 1 percent, women represent a quarter of those between the 99th and 99.9th percentiles and only 16% of those in the top 0.01%.
The share of women in the top income groups has hardly changed during the last two decades. Despite strong economic growth and EU accession in 2004, women are as underrepresented among the rich today as they were in 2000.
Figure 6: Raw gender income gap
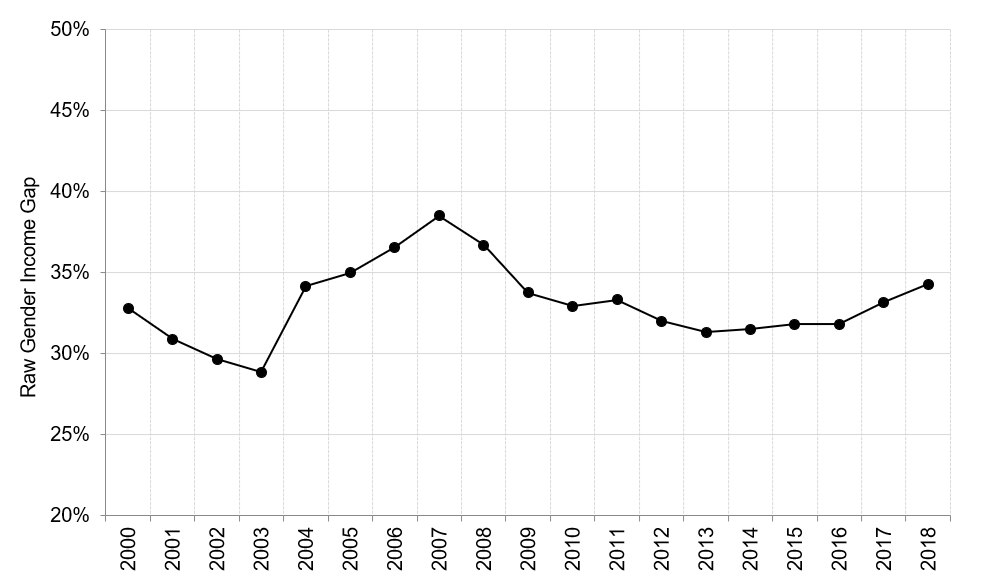
Source: Bukowski, P., Chrostek, P., Novokmet, F., & Skawiński, M. (2023). Income inequality in the 21st century Poland. CEP Discussion Paper No. 1966
As documented in the figure above, since 2000 the average raw gender income gap was around 33%, meaning that the income of women is on average one-third lower than that of men.
The gap has remained largely unchanged between 2000 and 2018. If anything, the gap in 2018 was 1 percentage point larger than in 2000.
The high level of income gender gap is driven by three factors: 1) a low share (25%) of women among business owners, who are on average richer than workers; 2) large income gaps between male and female business owners; 3) a growing gender gap in pensions.
References:
Bukowski, P., & Novokmet, F. (2021). Between communism and capitalism: long-term inequality in Poland, 1892–2015. Journal of Economic Growth, 26(2), 187-239;
Bukowski, P., Chrostek, P., Novokmet, F., & Skawiński, M. (2023). Income inequality in the 21st century Poland. CEP Discussion Paper No. 1966

Notes from Poland is run by a small editorial team and published by an independent, non-profit foundation that is funded through donations from our readers. We cannot do what we do without your support.
Main image credit: Adam Borkowski/Unsplash